


Aftershock Map for M5.4 Willow Creek Earthquake
04/29/2008 20:03 PDT
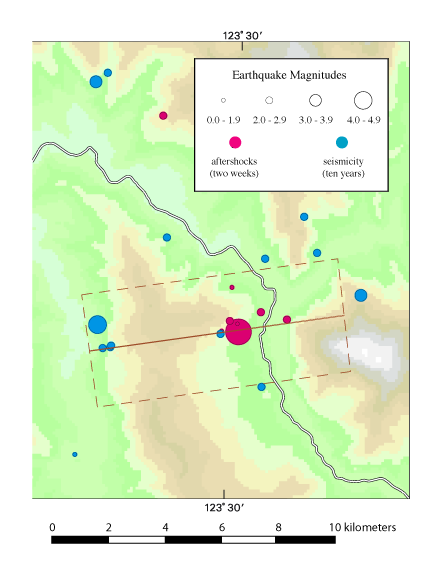
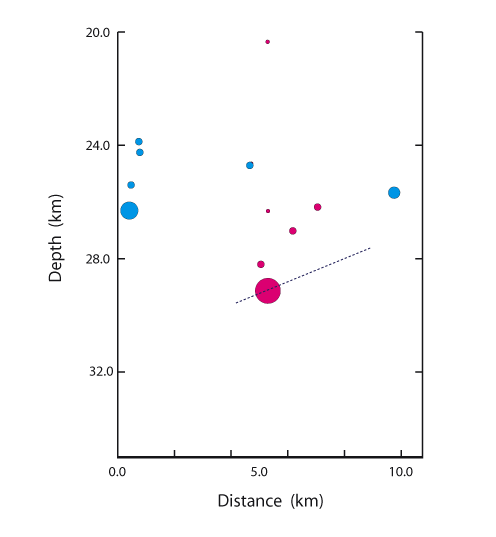
The first figure below is a map, the second is a cross-section. The map shows the epicenters and magnitudes of the Willow Creek main shock (large magenta circle), two weeks of aftershocks (smaller magenta circles), and 10 years of background seismicity (blue circles). The red lines are mapped faults, and the colored background indicates elevation. The dashed brown lines contain the earthquakes whose hypocenters are plotted as a function of depth and distance along strike in the cross-section. Because this earthquake occurred on a normal fault (probably in the subducted slab,) we chose a cross-section perpendicular to the strike of the fault. The dashed dark-blue line on the cross-section approximates the rupture extent of the earthquake, as inferred from the rupture directivity and the M5.4 magnitude. For this earthquake, the rupture direction agrees fairly well with the offset of the aftershocks, although it is deeper and has a slightly shallower dip.
« Back to directivity plot for this event
