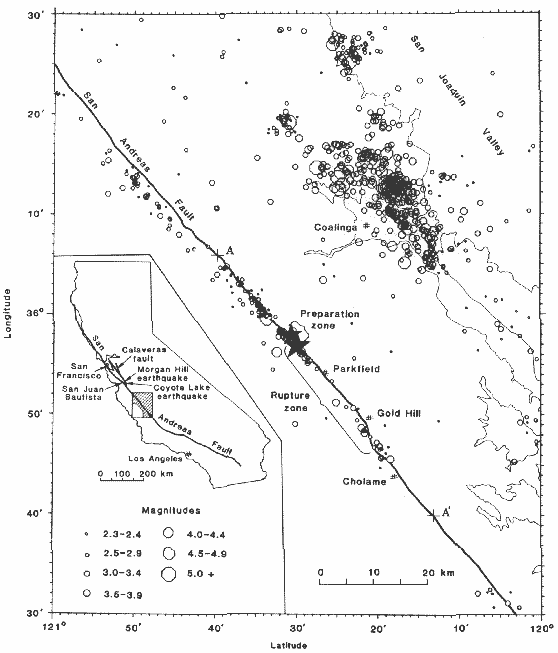
Fig. 1. Map of earthquake epicenters (1975-1984) relative to the trace
of the San Andreas fault (bold line) and the epicenters of the foreshock
(ML 5.1) and the main shock in 1966 (small and large stars,
respectively, near the center of the map). All epicenters were calculated
from a crustal velocity model designed specifically for the Parkfield
section of the San Andreas fault (55). Brackets along the fault show the
preparation zone and rupture zone of characteristic Parkfield earthquakes.
Epicenter clusters near the western edge (faint line) of the San Joaquin
Valley are aftershocks of the earthquakes at Cantua Creek in 1975, at
Avenal in 1976, at New Idria in 1982, and at Coalinga in 1983. Epicenters
for all earthquakes of ML 2.3 or greater are shown,
except the very many aftershocks (ML < 3) of the
1983 Coalinga earthquake, which cover the Coalinga area when plotted.